Beacon
Uptime monitoring for the containers I self-host
- Watches from outside the box
- Correctness enforced by the database
- 292 tests against a real Postgres
I run a handful of Docker containers at home that are reachable from the internet. Beacon exists because I kept finding out one of them had fallen over by trying to use it.
The one rule
Beacon must not share a fate with the things it watches. Its entire job is to notice when something has stopped answering, which it cannot do if one failure takes them both out.
My first instinct was a separate box in the house, and that is not enough. A power cut, a dead router or an ISP outage takes down the services and the monitor — and that is precisely the failure you most want to hear about. So it runs off-premises on a free-tier VM with its own power and its own connection, and reaches the services over the public internet exactly as anyone else would. It is testing the path in, not just the process.
One question per page
The dashboard answers is anything wrong right now — in a sentence, before any table. If something is down it says which service and for how long; if nothing is, it says so and gets out of the way. It should be readable from a phone in a few seconds.
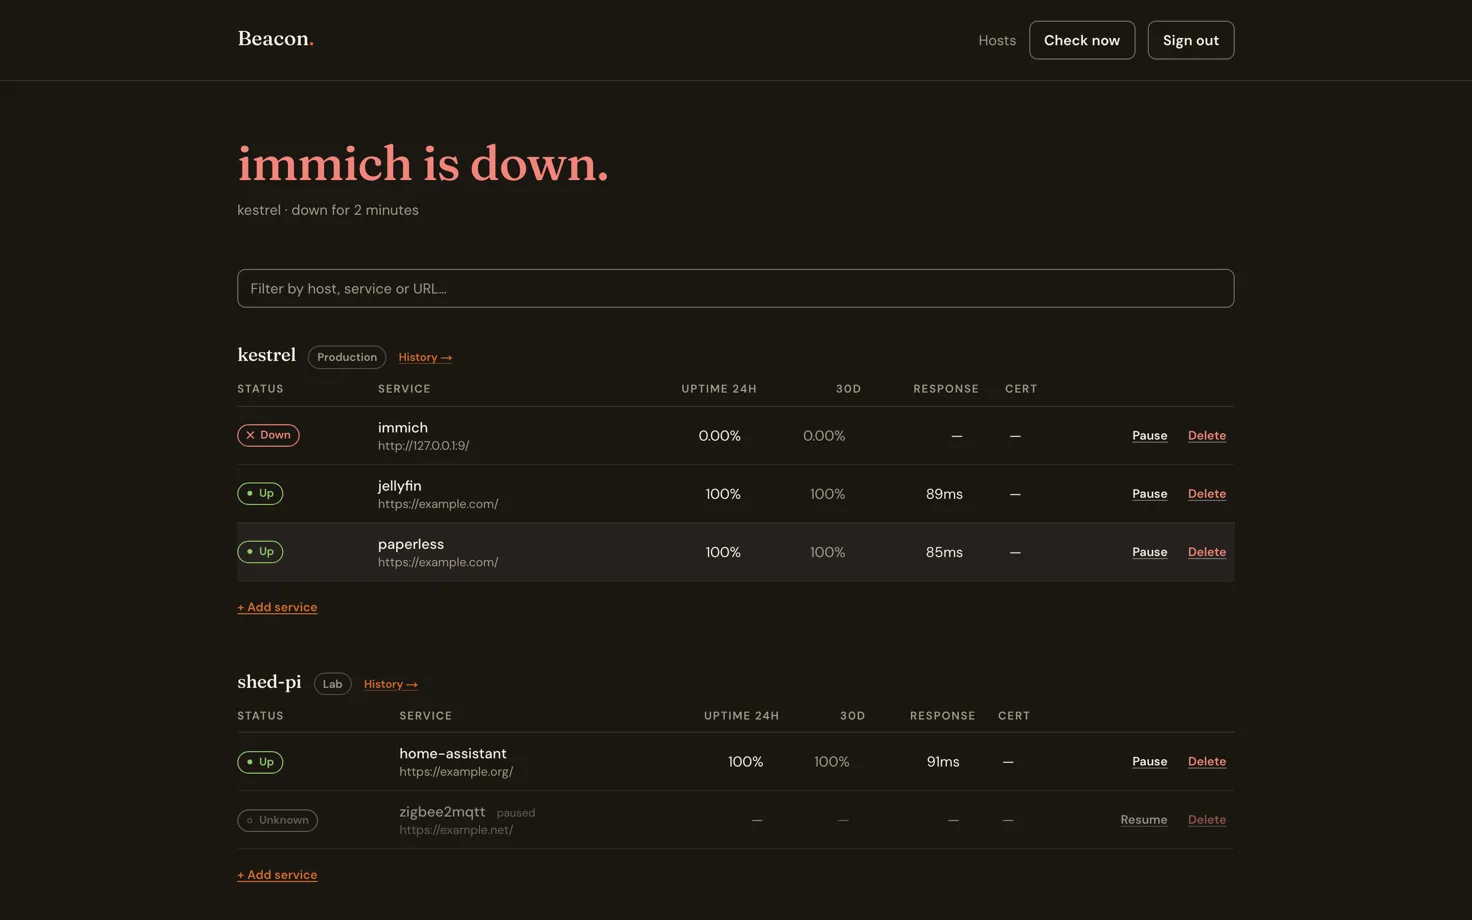
Services are grouped by host — the machine they run on. That is not cosmetic. It is what makes "the NUC is down" one line rather than six identical alerts, and it is the unit history is kept against.
host          a machine — the NUC under the stairs, a Pi, a VPS
 └── monitor  a service on it, checked on its own schedule
      ├── check_result   one row per probe, pruned at 30 days
      ├── incident       one open per monitor per kind
      └── daily_uptime   the rollup that survives pruning
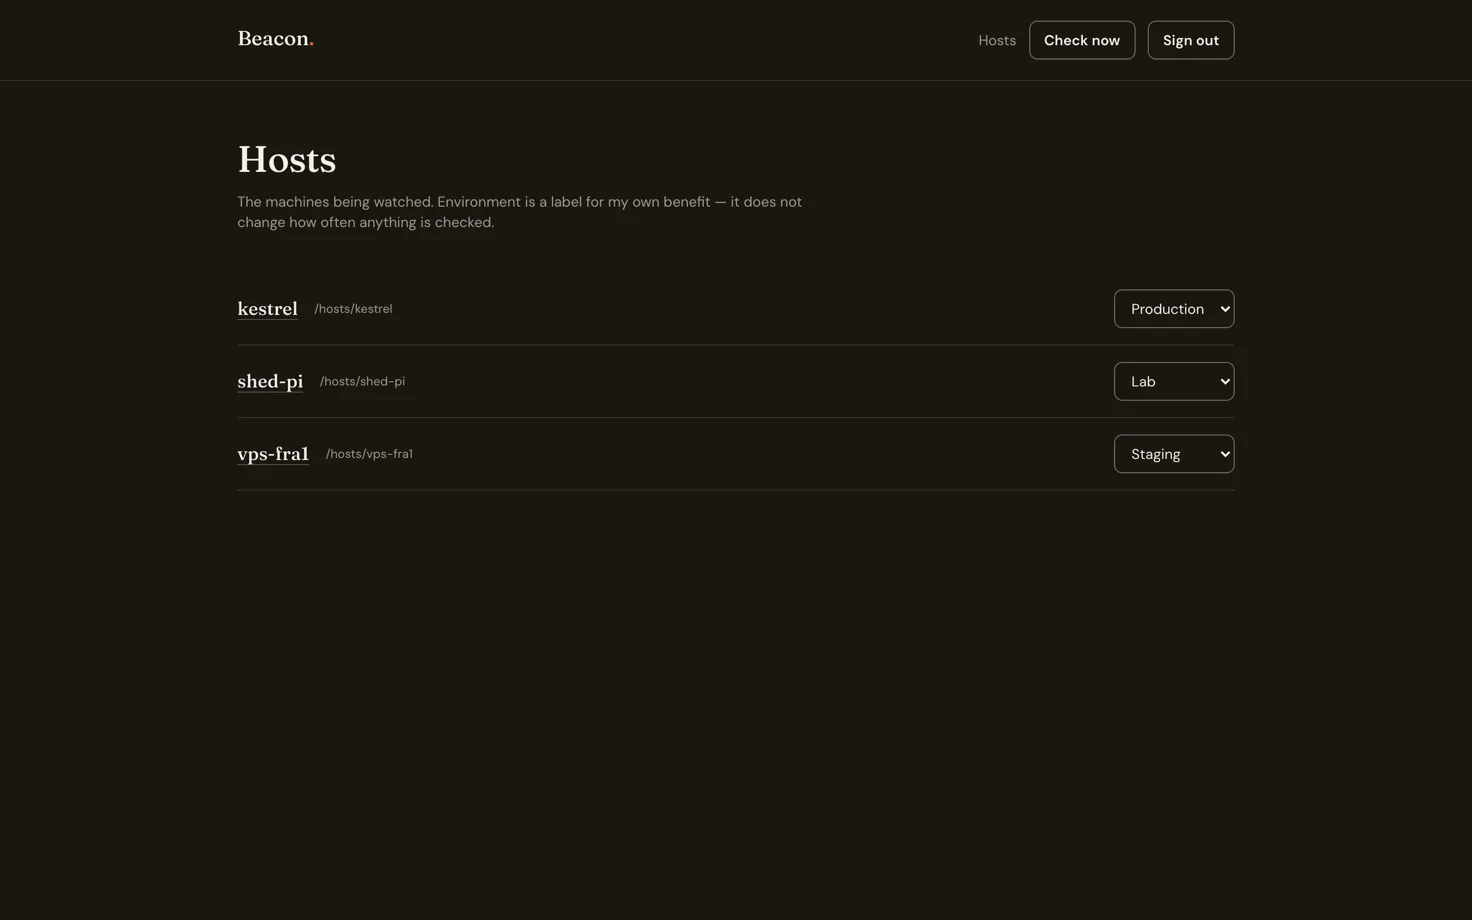
Deciding what counts as down
A single failed check is not an outage. The default is two consecutive failures before an incident opens, which at 60-second checks means roughly two minutes to notification — long enough that a dropped packet or a container restart never emails anyone, short enough to be useful. One failure would make the whole thing something you learn to ignore, which is the actual failure mode for alerting tools.
Recovery closes the incident and sends a second email. Alerts are written to the database before the send is attempted, so a crash mid-send leaves the row unsent and the next cycle retries it. At-least-once delivery is the right trade here: a duplicate email beats a missed outage.
Correctness that does not depend on my code being careful
Two concurrent check cycles must not both open a "down" incident for the same service. Rather than
guard that in application logic, it is a partial unique index — one open incident per monitor
per kind, WHERE resolved_at IS NULL. The second writer gets a constraint violation from
Postgres. The rule holds regardless of what the application does next.
Raw checks are pruned at 30 days and rolled up into daily uptime first, because 20 services at 60-second intervals is about 10.5 million rows a year, and "uptime over the last 90 days" should still be one cheap read.
The other question: has this been happening
Each host has a history page — 90 days of uptime as a strip, response times, and the incidents behind them. A missing day renders as a third state rather than as zero, because a day with no data is not a day with an outage, and colouring it red would invent one.
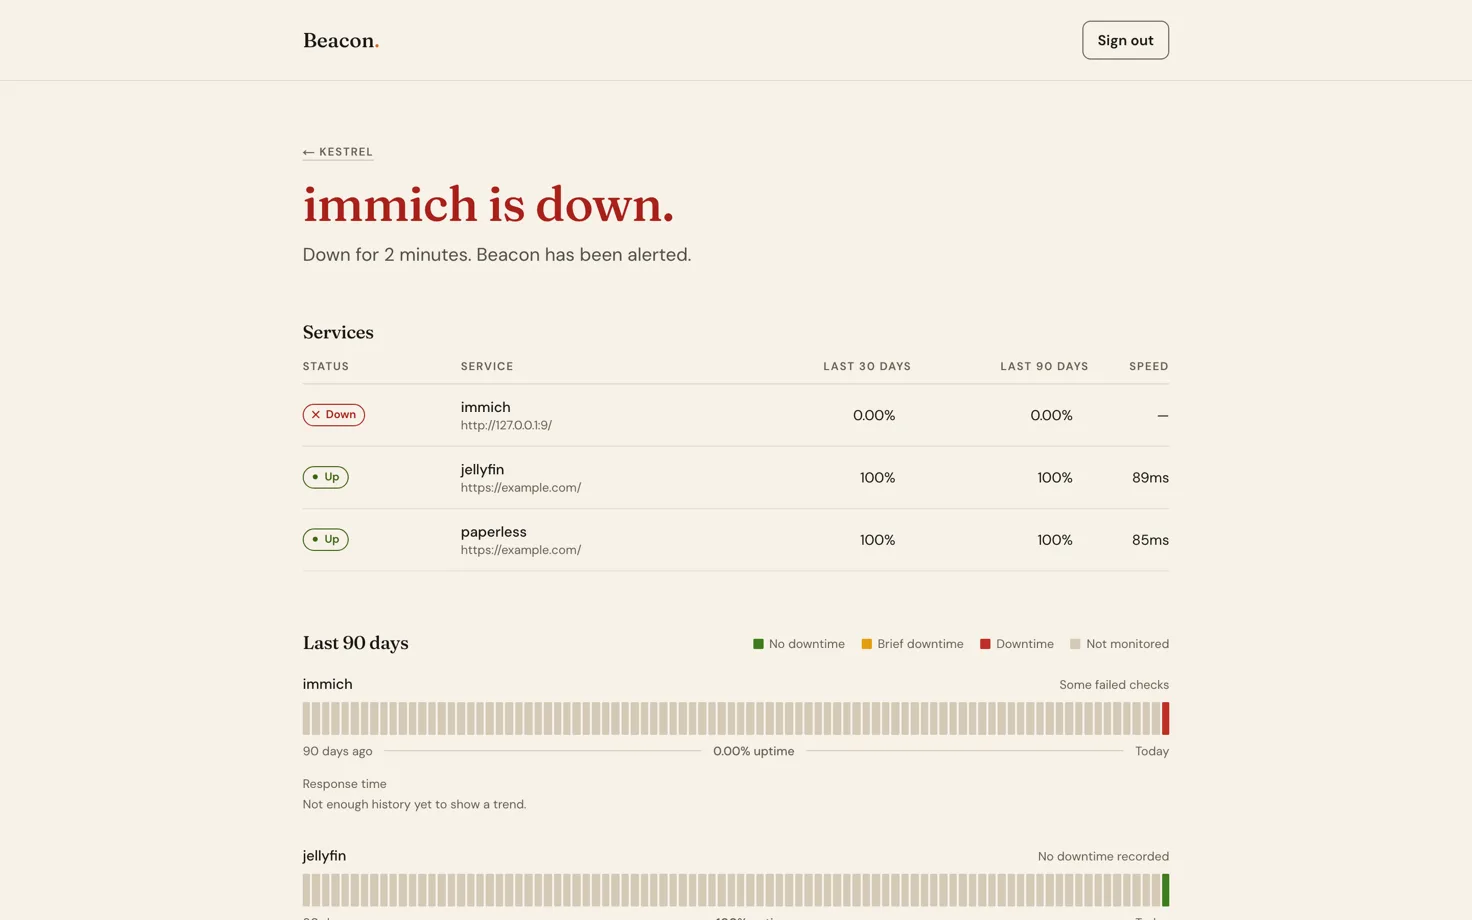
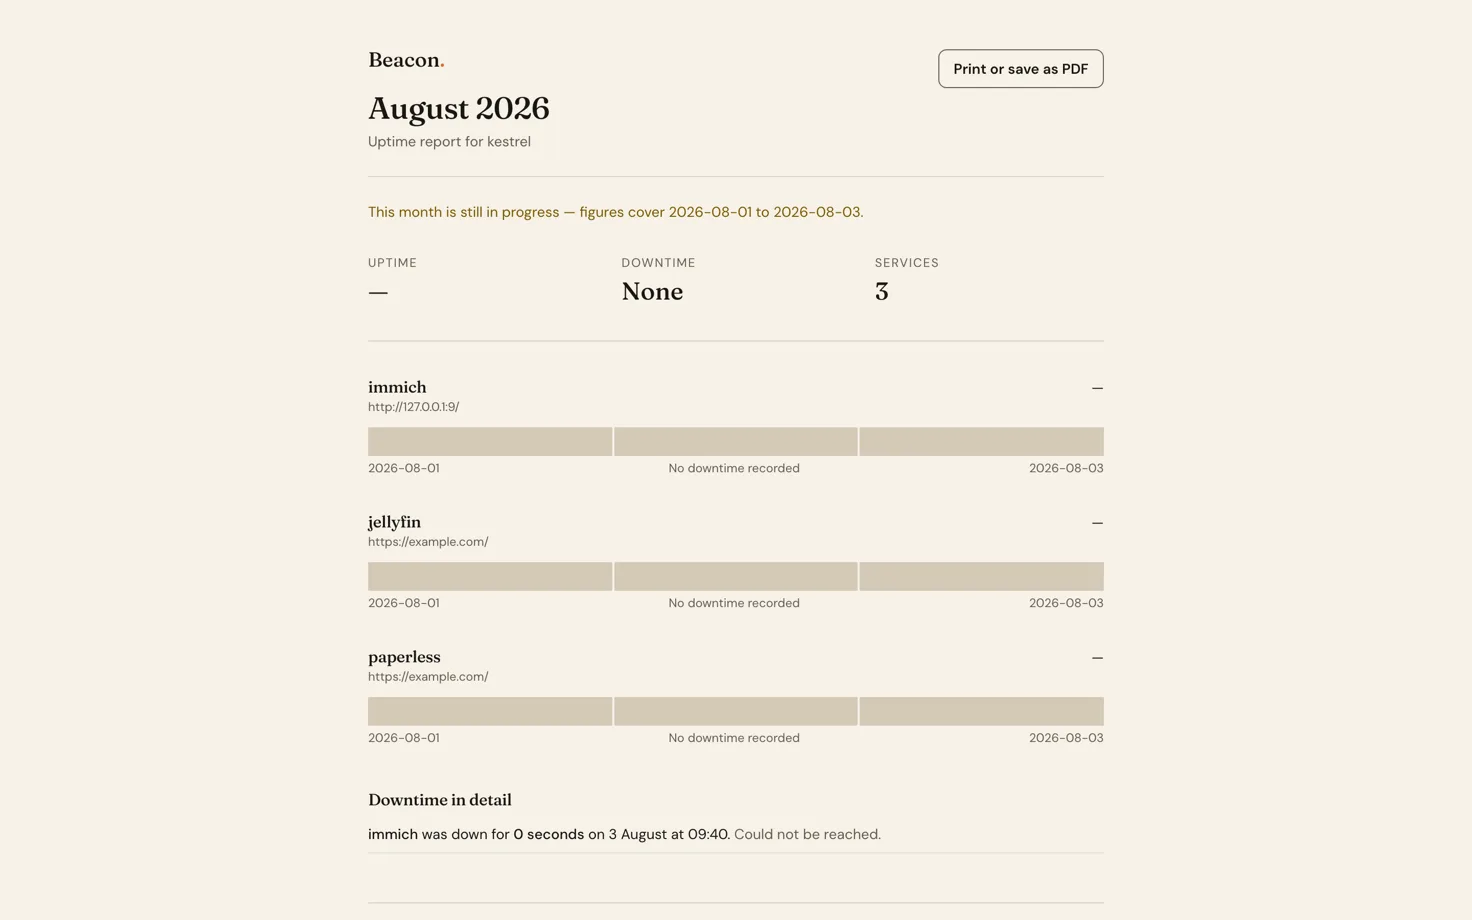
Months are also rendered as a printable page rather than a generated PDF, so there is no headless browser in the container and the browser's own "Save as PDF" does the work.
Nothing dials in
Both ends use a Cloudflare Tunnel, in opposite directions. The services at home are reachable without a single inbound port open, no port forwarding and no certificates to renew. Beacon's own dashboard is published the same way, which on a cloud VM means never touching a firewall — and Oracle Cloud has two independent ones that disagree with each other, so avoiding both is worth more than it sounds.
The tunnel dials out; nothing dials in.
Tested against a real database
292 tests, and the integration ones run migrations against Postgres compiled to WASM rather than a mock. That matters for this app specifically: a mocked database would happily accept the duplicate incident the partial unique index exists to reject, so the test would pass and the constraint would be decoration.
Configuration is load-bearing
A note I left in the deployment guide for my future self, after it bit me twice: every application
variable must be NUXT_-prefixed. Nitro bakes runtimeConfig at build time and re-reads it at
runtime only from NUXT_*. Set ADMIN_PASSWORD_HASH instead of NUXT_ADMIN_PASSWORD_HASH and
sign-in returns a 503 while docker compose exec shows you a perfectly correct-looking value in
the environment. The container starts, the dashboard loads, and the one thing you need it to do
fails silently.
The helper script that generates the hash was printing the unprefixed name — walking people directly into the trap its own documentation warned about. Small operational details like that are most of what running your own infrastructure actually is.